


AltME groups: search
Help · search scripts · search articles · search mailing listresults summary
| world | hits |
| r4wp | 0 |
| r3wp | 38 |
| total: | 38 |
results window for this page: [start: 1 end: 38]
world-name: r3wp
| Group: Core ... Discuss core issues [web-public] | ||
| Anton: 14-Oct-2006 | It can plot a graph of the balance over the last year, so I can see the patterns and trends. | |
| Group: Script Library ... REBOL.org: Script library and Mailing list archive [web-public] | ||
| Graham: 5-Jan-2005 | I was looking for q-plot in the library, and see it's not there. But I found it here: http://www.reboltech.com/library/html/q-plot.html The q-plot tutorial is however on rebol.org | |
| Graham: 5-Jan-2005 | Anyone got a non corrupt copy of q-plot.r ? | |
| eFishAnt: 8-Jan-2006 | I fixed the ez-plot.r q-plot.r condense.r get-stock.r script combo for View 1.3.2 (get-stock.r had broken) and I sync'ed it to Developer/Users/steve-shireman/ez-plot-updates I tried on both IOS Link and View1.3.2, so hope it works on all the others. Feel free to stick it in the Library. | |
| Allen: 14-May-2006 | Is q-plot.r still in the rebol.org library? Couldn't find it, only found ez-plot.r | |
| Oldes: 5-Mar-2007 | There is this script in the library http://www.rebol.org/cgi-bin/cgiwrap/rebol/view-script.r?script=ez-plot.r but there seems to be missing the q-plot.r script, which is required:( | |
| Sunanda: 6-Mar-2007 | Thanks. It's in the Library now: http://www.rebol.org/cgi-bin/cgiwrap/rebol/view-script.r?script=q-plot.r | |
| Group: View ... discuss view related issues [web-public] | ||
| Graham: 7-Jan-2005 | I was just playing with the q-plot, and the output seemed a little plain ... | |
| Graham: 8-Jan-2005 | Has anyone used q-plot? | |
| Graham: 8-Jan-2005 | >> date-data: [ 1-Jan-2005 2-Jan-2005 3-Jan-2005 1-Dec-2005 ] == [1-Jan-2005 2-Jan-2005 3-Jan-2005 1-Dec-2005] >> y-data: [ 1 2 3 4 ] == [1 2 3 4] view quick-plot [ 800x300 x-data [(date-data)] line [(y-data)] x-axis 6 ] which draws a very straight line. | |
| Scott: 8-Jan-2005 | G: I don't recall q-plot as being date-smart. It just thinks you are feeding four data points. | |
| Ladislav: 8-Jan-2005 | Graham: re quick plot - yes, I had to make some changes to be able to draw xy graph with irregular x values. Unfortunately I didn't correct the behaviour for dates. I will probably include XY graphing capabilities into my spider.r, because the "philosophy" of q-plot looks a bit "flawed" to me - it is "two-pass" (acceptable) evaluating expressions twice , which looks | |
| Graham: 8-Jan-2005 | Ladislav, do you have a fixed version of q-plot for irregular x values? I can use seconds instead of date values. | |
| Ladislav: 9-Jan-2005 | Graham: check the http://www.fm.vslib.cz/~ladislav/rebol/q-plot.r The script was used e.g. by http://www.fm.vslib.cz/~ladislav/rebol/present.r , e.g. the probability plot is expected to have irregular X values | |
| Brock: 23-Sep-2005 | Don't know if quick-plot by Matt Licholai would help you guys in any way. | |
| Brock: 23-Sep-2005 | I know it can be found by googling q-plot.r. Ladislav has done some work that used q-plot, not sure if he's enhanced it or if anyone else has. | |
| Volker: 17-Feb-2006 | IIRC there was some cool charting in the library, something with "plot"? but not sure about pie | |
| Pekr: 17-Feb-2006 | ez-plot? not sure pie-charts were there ... | |
| Robert: 17-Feb-2006 | ez-plot doesn't have pie charts | |
| Robert: 21-Feb-2006 | Be aware of linebreaks:
data: [
18 cyan
22 blue
15 green
20 yellow
10 purple
54 magenta
]
sum: 0
foreach [val color] data [sum: sum + val]
plot: copy [
pen black
]
total: 0 ; we start at 0 degree
foreach [val color] data [
angle: 360 * val / sum
repend plot [
'fill-pen color
'arc 125x125 90x90 total angle 'closed
'text 'anti-aliased to-string val 125x125 + to-pair reduce [110 *
(cosine (total + (angle / 2))) - 5 110 * (sine (total + (angle /
2))) - 5]
]
total: total + angle
]
view layout [
box snow 250x250 effect reduce ['draw plot]
]
| |
| Graham: 3-Jun-2006 | Does date plotting working in q-plot? | |
| Graham: 3-Jun-2006 | do %q-plot.r date-data: [ 6-Apr-1993 11-Apr-1993 15-Apr-1993 27-Apr-1993 11-May-1993 25-May-1993 22-Jun-1993 27-Jul-1993 7-Oct-1993 15-Feb-1994 4-Oct-1994] y-data: [ 2.3 3.2 3.4 3.8 4.45 5.0 6.6 7.53 8.7 9.4 11.1] val: 6 view quick-plot [ 800x600 x-data [(date-data)] line [(y-data)] x-axis (val) border x-grid (val) ] | |
| Group: PDF-Maker ... discuss Gabriele's pdf-maker [web-public] | ||
| Graham: 3-Apr-2006 | I'd like somehow to plot a child's growth over the top of a pdf such as this. | |
| Graham: 3-Apr-2006 | I'd hate to have to redraw this in the plot dialect just to stick a few points on it. | |
| Group: AGG ... to discus new Rebol/View with AGG [web-public] | ||
| DideC: 13-Jun-2005 | n: 1 plot: [ pen black line-width n arc 190x130 60x60 90 270 arc 390x130 60x60 180 270 arc 190x330 60x60 0 270 arc 390x330 60x60 270 270 ] view center-face layout [ bx: box 580x450 effect [draw plot] sl: slider 580x20 [ n: 1 + (sl/data * 70) show bx ] ] | |
| DideC: 13-Jun-2005 | n: 0 plot: [ pen black line-width 2 arc 190x130 60x60 90 n closed arc 390x130 60x60 180 n closed arc 190x330 60x60 0 n closed arc 390x330 60x60 270 n closed ] view center-face layout [ bx: box 580x450 effect [draw plot] sl: slider 580x20 [ n: 1 + (sl/data * 360) show bx ] ] | |
| DideC: 13-Jun-2005 | n: 0 plot: [ fill-pen red pen black line-width 5 arc 190x130 60x60 90 n closed arc 390x130 60x60 180 n closed arc 190x330 60x60 0 n closed arc 390x330 60x60 270 n closed ] view center-face layout [ bx: box 580x450 effect [draw plot] sl: slider 580x20 [ n: 1 + (sl/data * 360) show bx ] ] | |
| DideC: 13-Jun-2005 | rebol [title: "ARC's Draw command test"] begin: angle: 0 lines?: 'closed plot: [ fill-pen red pen black line-width 5 arc 100x100 90x90 begin angle lines? ] view center-face layout [ bx: box 200x200 effect [draw plot] across style vt vtext 60 right vt "Start:" scroller 392x16 [angle: face/data * 360 show bx] return vt "Angle:" scroller 392x16 [begin: face/data * 360 show bx] return vt "Type :" toggle "open it" "closed it" [either face/data [lines?: none] [lines?: 'closed] show bx] ] | |
| Group: !RebGUI ... A lightweight alternative to VID [web-public] | ||
| DanielP: 5-Mar-2008 | I try to use RebGui with Q-Plot but the plot is in a separate window instead of to be inserted intto rebgui display. | |
| DanielP: 5-Mar-2008 | do %rebgui.r
do %q-plot.r
append-widget [
plot-widget: make rebface[
view quick-plot [
300x300
fill-pen blue
pen red
bar-width 15
bars [5 3 8 2 10 3 4 9 5 7]
label "Meaningless bars"
y-axis 9
]
]
]
display "Plot 1" [
group-box "Graphique" data [plot-widget]
]
do-events
| |
| DanielP: 6-Mar-2008 | pane: reduce [
quick-plot [
300x300
fill-pen blue
pen red
bar-width 15
bars [5 3 8 2 10 3 4 9 5 7]
label "Meaningless bars"
y-axis 9
]
]
| |
| Group: Rebol School ... Rebol School [web-public] | ||
| PeterWood: 17-May-2006 | You may want to take a look at Matt Licholai's quick plot dialect for your students to use to plot results. The details are at http://www.rebol.org/cgi-bin/cgiwrap/rebol/ml-display-thread.r?m=rmlQBZK Scroll down the thread to find the location of the source. There is an updated version of his ez-plot example in the script library at http://www.rebol.org/cgi-bin/cgiwrap/rebol/view-script.r?script=ez-plot.r | |
| Group: Postscript ... Emitting Postscript from REBOL [web-public] | ||
| Graham: 6-Apr-2006 | So, for example, if we used to plot dialect to draw a graph, we can then emit postscript and send directly to the printer. | |
| Graham: 6-Apr-2006 | used the Plot dialect .. | |
| Graham: 8-Jun-2006 | I know about ez-plot being capable of doing very useful plots ( barring sequential date data ). | |
| Group: !Cheyenne ... Discussions about the Cheyenne Web Server [web-public] | ||
| btiffin: 13-Apr-2007 | I'm thinkin' ez-plot/q-plot might be a nice place to start for that app. Hmmm. | |
| Group: !REBOL3 ... [web-public] | ||
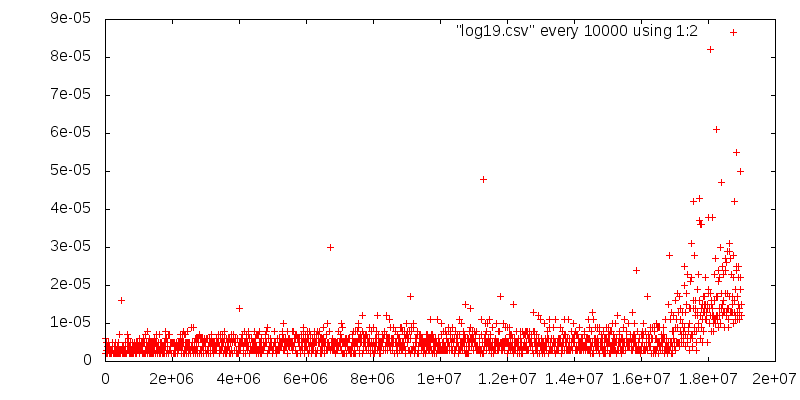
| Andreas: 14-Dec-2010 | Here's a plot of the DT for each "put" operation (m/(i): i) for 19M puts: http://bolka.at/2010/rebol3/tmp/raw19.png | |
| Group: Red ... Red language group [web-public] | ||
| Kaj: 17-Aug-2011 | #include %../SDL.reds
log-error: does [ ; Log current SDL error.
print [sdl-form-error newline]
]
red: as-byte FFh
green: as-byte FFh
blue: as-byte FFh
screen: as sdl-surface! 0
event: declare sdl-event!
mouse-event: declare sdl-mouse-motion-event!
either sdl-begin sdl-init-all [
screen: sdl-set-video-mode 640 480 32 sdl-software-surface
either as-logic screen [
while [all [
sdl-await-event event
event/type <> as-byte sdl-quit
]][
if event/type = as-byte sdl-mouse-moved [
mouse-event: as sdl-mouse-motion-event! event
if as-logic (as-integer mouse-event/pressed?) and FFh [
unless plot screen mouse-event/x-y and FFFFh mouse-event/x-y >>>
16 red green blue [
log-error
]
]
]
]
][
log-error
]
sdl-end
][
log-error
]
| |