


AltME groups: search
Help · search scripts · search articles · search mailing listresults summary
| world | hits |
| r4wp | 2 |
| r3wp | 65 |
| total: | 67 |
results window for this page: [start: 1 end: 67]
world-name: r4wp
| Group: #Red ... Red language group [web-public] | ||
| Robert: 18-Aug-2012 | Well, IMO than it's not really so clearly stated. Taking a look at chart 10, confuses me. Maybe it's the wording. Doc, I would simplify all this to more commone terms to make it as simple as possible for new users. | |
| Group: Ann-Reply ... Reply to Announce group [web-public] | ||
| Scot: 15-Feb-2013 | Never forget the talk I heard by Joe Green the former CEO of Humana. He showed us an organizational chart written upside down with his name at the top. He flipped over the chart which put himself at the bottom with the lettering now right side up. He said, "When I realized that my job was to love the four people above me in the chart, the organization really took off." | |
world-name: r3wp
| Group: All ... except covered in other channels [web-public] | ||
| Terry: 31-Dec-2004 | Earthquake frequency chart upto 2000 http://www.wadhome.org/quakes/ | |
| eFishAnt: 15-Jan-2005 | (I know that's ascii...was just downloading the chart...but guess I should write a script...) | |
| Reichart: 19-Apr-2008 | I know most people here are still treating SaaS as a red headed step child�but guys, it IS what is happening� : ) Check this out: http://code.google.com/apis/chart/#url_format They got to it before Richard and I could complete ours, and given there license (don't worry about it if you use it less than 250K times a day!), we are probably just going to support it directly. How about writing a REBOL interface that lets you test it first, then out puts Google compatible REST? Even without Google Charts, it is a stand alone useful program, but WITH Google, it might get noticed by the public. One should be able to whip this together quickly, and it would be a useful simple report component everyone could use. | |
| Reichart: 19-Apr-2008 | Just so I'm clear, what is missing from this: http://chart.apis.google.com/chart?cht=lc&chs=200x100&chd=s:frothsmzndyoteepngenfrothsmzndyoteepngen&chxt=x,y&chxl=0:|Apr|May|June|1:||50+Kb | |
| Reichart: 31-Oct-2008 | Anyone know of a markup language that outputs flow charts? Something like: (Start) -> [Get input] -> (End) And this would out put a smartly laid out flow chart. | |
| Group: Ann-Reply ... Reply to Announce group [web-public] | ||
| Chris: 10-Aug-2008 | Re: Google Charts API -- there's not much finesse to it, just looks nicer than the ugly API: view layout [ image chart [ size: 150x40 type: 'sparkline data: [45 55 38 35 37 58 59 64 60] color: black area: [color solid 255.255.255.204] ] ] | |
| Brock: 10-Aug-2008 | Chris, I get an error... connecting to: chart.apis.google.com ** Access Error: Cannot open /c/documents and settings/brock/application data/rebol/public/chart.apis.google.com/c hart?cht=ls&chs=150x40&... ** Where: read-thru ** Near: write/binary file data if all | |
| Chris: 10-Aug-2008 | It looks like a problem with 'load-image in that Rebol version. Try changing the -- image chart [ -- line to -- image load chart [ | |
| Chris: 6-Sep-2010 | As far as I can make out, Google Charts API works in R3 as well. Project page: http://www.ross-gill.com/page/Google_Charts_and_REBOL Other marker types: line, arrow, cross, diamond, rectangle, diamond, square, horizontal lines, x. They all follow the same basic structure: name, opt color, index, opt points, size, z-index. See the page on Compound Charts for more info: http://code.google.com/apis/chart/docs/gallery/compound_charts.html | |
| Chris: 6-Sep-2010 | Also, 'chart takes an object as an argument too, so you can reuse data: sample: context [type: 'line data: [10 95 60 95 10] bars: none] browse chart sample sample/type: 'bar sample/bars: [55 8] browse chart sample | |
| Group: Core ... Discuss core issues [web-public] | ||
| [unknown: 10]: 8-Aug-2005 | somekind of comparisment chart... | |
| Terry: 12-Nov-2005 | rebol [] theTOC: ask "Table of contents (seperate with <p></p> tags): " theHeader: ask "Header: " theNumOfBars: ask "Number of chart bars: " outputPath: ask "Save path (with trailing / ie: c:/): " getTemplate: read http://o7o.org/files/aflax/examples/barchart/barchart.html getSWF: read/binary http://o7o.org/files/aflax/examples/barchart/aflax.swf replace/all getTemplate "$TOC" theTOC replace/all getTemplate "$theHeader" theHeader replace/all getTemplate "$numOfBars" theNumofBars write to-rebol-file join outputPath "barExample.html" getTemplate write/binary to-rebol-file join outputPath "aflax.swf" getSWF browse to-rebol-file join outputpath "barExample.html" | |
| Henrik: 13-Oct-2006 | >> do http://www.fm.tul.cz/~ladislav/rebol/spider.r connecting to: www.fm.tul.cz Script: "Spider" (8-Sep-2006/16:40:58+2:00) ** Script Error: lfunc has no value ** Near: spider*: lfunc [ [catch] description [block!] "a block containing a description of a chart" ] [] [ current-... >> | |
| Group: Script Library ... REBOL.org: Script library and Mailing list archive [web-public] | ||
| Sunanda: 20-Jan-2005 | There's already an optional "see also" header, eg: http://www.rebol.org/cgi-bin/cgiwrap/rebol/view-script.r?script=ascii-chart.r And there's no reason why that can't generate a footnote in the same way that the "replaced-by" header does, eg: http://www.rebol.org/cgi-bin/cgiwrap/rebol/view-script.r?script=calc-engine.r All we need now is a volunteer to go through 600+ scripts and group them together. | |
| Sunanda: 12-Jan-2006 | Use the download URL, eg: do http://www.rebol.org/cgi-bin/cgiwrap/rebol/download-a-script.r?script-name=ascii-chart.r | |
| Sunanda: 25-Sep-2009 |
Something new in the Library....If you own scripts, you can add images
to them to make it all a bit more graphic.

Only example to date here:
    http://www.rebol.org/view-script.r?script=ascii-chart.r

Notes about how to add images to yoour scripts here:
    http://www.rebol.org/boiler.r?display=script-images

Thanks to Maxim for the original change request.
| |
| Group: View ... discuss view related issues [web-public] | ||
| DideC: 18-Feb-2006 | Cyphre is working on a pie chart library for Qtask. Ask him. | |
| Robert: 6-Mar-2006 | Sunanda, thanks for the link. Never found a tool where I could use a dialect to create a flow-chart. | |
| Henrik: 8-Jul-2008 | hmm.. I'm still not sure where it fits or how it's used. But if we stick with the chart drawing aspect: It would be possible to do as a dialect, and I think it should be inspired by graphviz. | |
| Henrik: 8-Jul-2008 | I'm just curious where it fits in: I thought it would be a way for a nurse to administer treatment to a patient, by following the flow chart, but it's a way for a doctor to plan the treatment? | |
| james_nak: 8-Jul-2008 | Thanks Graham for the 3flex link. That's interesting. Perhaps Henrik's Relations-Engine might be something you can use. I myself have been tinkering around with it and attempting to parse the data to work with a chart making program. In my case I am planning on using http://www.maani.us/xml_charts/ . | |
| Group: AGG ... to discus new Rebol/View with AGG [web-public] | ||
| Christian: 10-Oct-2005 | Think chart servers, sparklines &c. | |
| Oldes: 5-Mar-2007 | never mind, I already used my rebol/flash dialect to make the chart. I just wanted to say, that there is probably a bug, because this is working: view layout [ box 400x400 effect [draw [ rotate 15 fill-pen red arc 200x200 90x90 0 108 closed fill-pen green arc 200x200 90x90 108 252 closed ]] ] | |
| Group: Announce ... Announcements only - use Ann-reply to chat [web-public] | ||
| Coccinelle: 5-Feb-2006 | I remember you that sql-protocol is able to process SELECT, INSERT, UPDATE and DELETE, and CREATE or DROP TABLE query and is able to join tables. ORDER BY and LIKE are supported but GROUP BY, COUNT, MAX and all other statistical functions are not yet supported. It can be also compatible with Microsoft ODBC Text Driver database (Delimited, CSVDelimited and TABDelimited tables) so you can share your database with other ODBC applications, like for example Excel to produce pivot table or pivot chart, or Word to produce letters and mailing. | |
| Chris: 6-Sep-2010 | Added markers to my Google Charts script: http://www.ross-gill.com/r/google-charts.r I feel like the addition is a bit messy, so ymmv. chart [data: [1 2 3 4]] ; basic usage chart [ size: 200x200 data: [ [10 30 50 70 90] [30 40 50 60 70] [70 60 50 40 30] [90 70 50 30 10] ] offset: 0 markers: [ financial 0.0.204 0 1x-1 20 ] ] If you use it, let me know how it goes. | |
| Group: !RebGUI ... A lightweight alternative to VID [web-public] | ||
| Ashley: 26-Feb-2006 | RebGUI goes Beta! With the fixing of some long running area / scroll / slider bugs I've finally reached a stable enough release candidate for 0.4.0 Beta; so, from a REBOL/View console: do http://www.dobeash.com/get-rebgui.r do view-root/public/www.dobeash.com/RebGUI/tour.r Also note that the demo directory includes a nifty new pie-chart widget demo (thanks Robert). I've also separated the 0.3.x and 0.4.x issues into separate sections: http://www.dobeash.com/it/rebgui/issues.html#section-2.3 Changes in this release include: Scrolling fixed (all area scroll / slider problems should be fixed, and a couple of minor field scrolling issues were also fixed) set-locale function to dynamically change locale files / dictionaries pie-chart widget added slider width reduced by 1/5 for area, table, text-list, drop-list, edit-list (looks better) table column arrows made smaller and darkened, plus right-most arrow moved to table boundary (more space for column heading text) and an important one from 0.3.9 that I omitted to mention last release: drop-list / edit-list now size to the smaller of number of items or available space in the bounding parent face (so no more lists that disappear off the edge of a face / window) Enjoy! | |
| Ashley: 20-May-2006 | Agreed. %tour.r and associated images added (also added pie-chart to tour under 'Graphic' - previously 'Picture' - category). | |
| Robert: 28-Aug-2006 | Cyphre and I have continued to fix bugs and enhance RebGUI. We still have some bugs to fix but than it's time for a new release. As new widgets we have done a CHART widget that lets you do bar, pie, torus charts. | |
| Robert: 28-Aug-2006 | The CHART stuff is based on draw. | |
| Ashley: 9-Dec-2006 | Build#48 committed to SVN, incorporating Robert's/Cyphre's extensive changes ((including new chart, drop-tree, grid, input-grid & panel widgets). Panel & Input-Grid added to %tour.r. These new widgets (apart from panel) have an impressive range of options/features ... but scant documentation or usage examples. If Robert/Cyphre could post a few examples here that would help. If anyone reads the source code and figures something out then an entry or two here would be appreciated: http://trac.geekisp.com/rebgui/wiki/WidgetList | |
| Robert: 9-Dec-2006 | Big ones still open are CHART and TABLE (added a lot of stuff as well). Other changes we did effect: group-box, field, radio-group | |
| Robert: 10-Dec-2006 | Chart: Will come next. That's a bit more complicate as it allows a lot customization. | |
| Ashley: 10-Dec-2006 | One thing I'd like changed with input-grid (and potentially grid and chart) is to separate the specification dialect into the options block and leave data as a block "of text values for all cells in the grid". It's difficult to do this for widgets like drop-tree and tab-panel where data and specification are merged, but where the separation is clean, as for table and input-grid, it makes it easier to conceptualize by having options/specification in one block (options) and values in another (data). | |
| Ashley: 14-Apr-2007 | chart, drop-tree, grid & input-grid need a bit of work to get them working again with Beta 2. | |
| Ashley: 15-Apr-2007 | chart, drop-tree, grid & input-grid need a bit of work to get them working again with Beta 2. | |
| Ashley: 16-Apr-2007 | Probably not something that will ever be part of the base release, but feel free to check it in to SVN and add an entry to WidgetList. The pie-chart widget and Robert's chart widget probably fall into the same category. I'll eventually figure out a good way of providing a base + optional widgets download facility. What I really want is a checklist of widgets to download which dynamically builds a tailored %rebgui.r ... sort of a "would you like fries with that" type facility. | |
| Ashley: 24-Dec-2007 | BTW Robert, please don't feel any of the work you and Cyphre have done is wasted or unappreciated. You created a solid fork early on that meets your requirements. The chart widget in particular just blows me away whenever I see it (you should post an image of %test-chart.r somewhere, it's one of the most beautiful displays I've seen). Even though none, or only a few, of the widgets you sent me may ever make it into the standard distro; they have proven invaluable as a source of ideas, coding techniques and motivation. Many specific things you did (e.g. tool-tips) have slowly but steadily migrated across. | |
| Claude: 6-Oct-2008 | REBOL[]
rebgui-build: %./rebgui-116/
rebdb-build: %./RebDB-203/
#include %/home/ramcla/Documents/rebol/rebol-linux-sdk-276/source/gfx-colors.r
#include %/home/ramcla/Documents/rebol/rebol-linux-sdk-276/source/gfx-funcs.r
#include join rebgui-build %rebgui.r
#include join rebdb-build %db.r
do join rebgui-build %rebgui.r
do join rebdb-build %db.r
to-amount-text: func[
data
/local
d
][
d: to-string to-money (to-decimal data)
return either d/1 = #"-" [join "-" (skip d index? find d #"$")][(skip
d index? find d #"$")]
]
table-exist?: func [
table [string!]
/local
w
][
w: to-word table
either error? err: try [db-describe :w][
disarm err
return false
][
return true
]
]
create-table: func [
table [string!]
/local
w
tables
][
tables: [
t_joueurs [id nom prenom date_naissance adresse code-postal commune
pays]
t_periodes [id nom date-debut date-fin status]
t_jeux [id period_id date lieu]
t_resultats [jeux_id personne_id manche_1 manche_2 manche_3]
t_resultat_historique [jeux_id personne_id manche_1 manche_2 manche_3]
]
w: to-word table
db-create :w (select tables w)
]
create-db: func [
/local
table
][
if not table-exist? table: "t_joueurs" [create-table table]
if not table-exist? table: "t_periodes" [create-table table]
if not table-exist? table: "t_jeux" [create-table table]
if not table-exist? table: "t_resultats" [create-table table]
if not table-exist? table: "t_resultat_historique" [create-table
table]
]
create-db
;print screen avec F3
ctx-rebgui/on-fkey/f3: make function! [face event] [
save/png %screen.png to image! face
browse %screen.png ; or call %screen.png
]
words: copy []
; clear words in global context
query/clear system/words
; show splash screen
splash join rebgui-build "images/logo.png"
; compose pie-chart data
pie-data: compose [
"Red" red 1
"Red-Green" (red + green) 1
"Green" green 1
"Green-Blue" (green + blue) 1
"Blue" blue 1
"Blue-Red" (blue + red) 1
]
; wrap display in a func so it can be called by request-ui
display/close rejoin ["Carte (build#" ctx-rebgui/build ")"] [
; button "Configure Look & Feel" 50 [if request-ui [unview/all show-tour]]
tight
after 1
menu #LW data [
"Maintenance" [
"Bienvenue" [panel-master/select-tab 1]
"Joueurs" [table_joueur 'rsh panel-master/select-tab 2]
"Periodes" [panel-master/select-tab 3]
"Jeux" [panel-master/select-tab 4]
]
"Option" [
"Quit" [quit]
"Print Screen" [alert "coucou"]
]
]
panel-master: tab-panel options [no-tabs] #LVHW data [
"Bienvenue" [
title-group %./images/setup.png data "bienvenue" "toto"
]
"Joueurs" [
label "nom : "
ask_nom: field 50
label "pr�nom :"
ask_prenom: field 50
button "Trouver"
return
maintenance_table_joueurs: table 200x50 #LW options [
"id" left .1
"nom" left .3
"prenom" left .3
"date de naissance" center .3
] data [] [table_joueur 'rtv]
return
label "ID :" 35
m_joueur_id: field 50 options[info]
return
label "Nom :" 35
m_joueur_nom: field 50
label "Pr�nom :" 35
m_joueur_prenom: field
return
label "Date de Naissance :" 35
m_joueur_date_naissance: field 43 tip "coucou" on-unfocus [
use[d][
d: copy face/text
either empty? d[
set-text m_joueur_age ""
][
either error? err: try [to-date d][
disarm err
set-color face red
][
set-color face CTX-REBGUI/COLORS/page
d: to-date d
set-text m_joueur_age (now/year - d/year )
set-text face to-date d
]
]
]
true
]
arrow [
use[d][
if not none? d: request-date[
set-text m_joueur_date_naissance d
set-text m_joueur_age (now/year - d/year)
]
]
]
label "Age :" 35
m_joueur_age: field 50 options [info]
return
label "Adresse :" 35
m_joueur_adresse: area 100x20 [print coucou]
return
label "Code Postal :" 35
m_joueur_code-postal: field 50
label "Commune :" 35
m_joueur_commune: field 50
return
label "Pays :" 35
m_joueur_pays: field 50
return
button "Ajouter" [table_joueur 'add]
button "Refresh" [table_joueur 'rsh]
button "Update" [table_joueur 'upd]
button "Supprimer" [table_joueur 'rmv]
]
"periodes"[text "lolo"
]
"jeux"[
text "lolo"]
]
message-area: area #LW "" 10x-1
][question "Vraiement ?"]
table_joueur: func [
act [word!]
][
switch act[
clr[
clear maintenance_table_joueurs/data
maintenance_table_joueurs/redraw
]
rsh[
table_joueur 'clr
insert tail maintenance_table_joueurs/data copy (db-select [id nom
prenom date_naissance ] t_joueurs)
maintenance_table_joueurs/redraw
probe maintenance_table_joueurs/rows
]
cmt[
db-commit t_joueurs
table_joueur 'rsh
]
rmv [
probe compose[id = (to-integer m_joueur_id/text)]
db-delete/where t_joueurs compose[id = (to-integer m_joueur_id/text)]
table_joueur 'cmt
]
add [
db-insert t_joueurs
compose[
next
(m_joueur_nom/text)
(m_joueur_prenom/text)
(to-date m_joueur_date_naissance/text)
(m_joueur_adresse/text)
(m_joueur_code-postal/text)
(m_joueur_commune/text)
(m_joueur_pays/text)
]
table_joueur 'cmt
]
upd [
db-update/where t_joueurs
[nom prenom date_naissance adresse code-postal commune pays]
compose [
(m_joueur_nom/text)
(m_joueur_prenom/text)
(to-date m_joueur_date_naissance/text)
(m_joueur_adresse/text)
(m_joueur_code-postal/text)
(m_joueur_commune/text)
(m_joueur_pays/text)
]
compose[id = (to-integer m_joueur_id/text)]
table_joueur 'cmt
]
rtv[
foreach [id nom prenom date_naissance adresse code-postal commune
pays] db-select/where * t_joueurs compose[id = (first maintenance_table_joueurs/selected)]
[
probe maintenance_table_joueurs/selected
set-text m_joueur_id id
set-text m_joueur_nom nom
set-text m_joueur_prenom prenom
set-text m_joueur_date_naissance date_naissance
set-text m_joueur_age (now/year - date_naissance/year)
set-text m_joueur_adresse adresse
set-text m_joueur_code-postal code-postal
set-text m_joueur_commune commune
set-text m_joueur_pays pays
]
]
]
]
do-events
| |
| Ashley: 30-Jul-2009 | RebGUI v2 RC1 (build 200) uploaded to SVN Focus of this version has been: * Make it look good (color scheme based on Windows 7) * Take into account OS sensibilities (different corner rounding, window colors, system fonts) * Get rid of the cruft (removal of little-used widgets and options) * Improve tabbing * Make it load and run faster Added icon get-fonts confirm request request-calc requesst-verify rebface/old-color rebface/over? Reimplemented arrow calendar drop-list password slider tool-bar set-state set-color Enhanced chat edit-list spinner table request-char request-font Removed question request-ui pie-chart symbol options [info no-click] options [arrow options] WIP A disable/enable function and layout option Rewrite of led widget Rewrite of tree widget | |
| Ashley: 31-Jul-2009 | removed symbol
... not cross-platform (depends on a specific symbol font) ... icon
is a better approach IMHO anyway
and question
... use confirm instead
options [ info ] is now gone too
... yep, soon to be replaced by a global disable/enable system (unlike
the widget-specific info implementation
Isn't this a personal thing
... less is more (and easier to debug/fix and maintain). pie-chart
(as an example) was a good widget, but anyone wanting to use it would
probably want a full range of graphing widgets, not just a single
representative example. Having said that, yell if I've removed something
vital and I'll add it back (or provide a functional alternative).
symbol ... use it beside a field to indicate a lookup widget is available
... use an icon or {button -1 "..."} instead (or an arrow)
sqlab ... what OS?
password field is now showing the text as text
... noted
| |
| Pekr: 31-Jul-2009 | hmm, SVN says: RebGUI v2 RC1 Added icon get-fonts confirm request request-calc requesst-verify rebface/old-color rebface/over? Reimplemented arrow calendar drop-list password slider tool-bar set-state set-color Enhanced chat edit-list spinner table request-char request-font Removed question request-ui pie-chart symbol options [info no-click] options [arrow options] WIP A disable/enable function and layout option Rewrite of led widget Rewrite of tree widget | |
| Group: Rebol School ... Rebol School [web-public] | ||
| Sunanda: 19-Nov-2008 |
Thanks Petr. He may have to wait for a supported UNICODE-enabled
release.


Having given it a few moments thought, he may be able to fake it
in *some* controls with font-name:

    view layout [box "hello" font-name "xxx"]  ;; where xxx is the name
    of an installed font on his machine.

I tried that with my ASCII chart script, making that change. And
it does (for me) show some Cyrillic. Not sure it's a complete solution
though:
   http://www.rebol.org/view-script.r?script=ascii-chart.r
| |
| Alexandr: 21-Nov-2008 | Thank you Pekr and Sunanda for your replies and suggestion on my question about unicode and cyrillic. I tried ascii-chart script and it unfortunately doesn't show any cyrillic letters :-( I understand you, I have to wait until r3 is released, but I don't want to wait for it (as I can see from forum posts it could be not very soon). | |
| Sunanda: 22-Nov-2008 |
Alexandr: < I tried ascii-chart script and it unfortunately doesn't
show any cyrillic letters>
What I did that showed me some cyrillic was this:
** download the ascii-chart.r script from rebol.org
** change this line
     [append hex-lo [box 25x25 blue]
to
    [append hex-lo [box 25x25 blue font-name "WP CyrillicA"]
WP CyrillicA

 is a Cyrillic font I happen to have installed on my Windows PC. Any
 Cyrilic font you have is likely to have a different name. When specifying
 the font name it is case sensitive.


If this works for you. it may also help for many VID styles (BOX,
BUTTON etc) It probably won't help for ALTER and other pop-up boxes
| |
| Anton: 8-Feb-2009 | (kib2: yes, creating a plotting dialect is hard. It must be - I tried creating a general plotting function. There are many types of chart/graph to support.) | |
| Group: Tech News ... Interesting technology [web-public] | ||
| [unknown: 9]: 1-Feb-2007 | Marketing Ideas to lawyers AN ARTICLE FROM SUNDAY'S NEW YORK TIMES WE SHOULD READ CAREFULLY. Awaiting the Day When Everyone Writes Software By JASON PONTIN Published: January 28, 2007 BJARNE STROUSTRUP, the designer of C++, the most influential programming language of the last 25 years, has said that �our technological civilization depends on software.� True, but most software isn�t much good. Too many programs are ugly: inelegant, unreliable and not very useful. Software that satisfies and delights is as rare as a phoenix. Skip to next paragraph Sergei Remezov/Reuters Charles Simonyi, chief executive of Intentional Software, in training for his trip to the International Space Station, scheduled for April. Multimedia Podcast: Weekend Business Reporters and editors from The Times's Sunday Business section offer perspective on the week in business and beyond. How to Subscribe All this does more than frustrate computer users. Bad software is terrible for business and the economy. Software failures cost $59.5 billion a year, the National Institute of Standards and Technology concluded in a 2002 study, and fully 25 percent of commercial software projects are abandoned before completion. Of projects that are finished, 75 percent ship late or over budget. The reasons aren�t hard to divine. Programmers don�t know what a computer user wants because they spend their days interacting with machines. They hunch over keyboards, pecking out individual lines of code in esoteric programming languages, like medieval monks laboring over illustrated manuscripts. Worse, programs today contain millions of lines of code, and programmers are fallible like all other humans: there are, on average, 100 to 150 bugs per 1,000 lines of code, according to a 1994 study by the Software Engineering Institute at Carnegie Mellon University. No wonder so much software is so bad: programmers are drowning in ignorance, complexity and error. Charles Simonyi, the chief executive of Intentional Software, a start-up in Bellevue, Wash., believes that there is another way. He wants to overthrow conventional coding for something he calls �intentional programming,� in which programmers would talk to machines as little as possible. Instead, they would concentrate on capturing the intentions of computer users. Mr. Simonyi, the former chief architect of Microsoft, is arguably the most successful pure programmer in the world, with a personal fortune that Forbes magazine estimates at $1 billion. There may be richer programmer-billionaires � Bill Gates of Microsoft and Larry Page of Google come to mind � but they became rich by founding and managing technology ventures; Mr. Simonyi rose mainly by writing code. He designed Microsoft�s most successful applications, Word and Excel, and he devised the programming method that the company�s software developers have used for the last quarter-century. Mr. Simonyi, 58, was important before he joined Microsoft in 1981, too. He belongs to the fabled generation of supergeeks who invented personal computing at Xerox PARC in the 1970s: there, he wrote the first modern application, a word processor called Bravo that displayed text on a computer screen as it would appear when printed on page. Even at leisure, Mr. Simonyi, who was born in Hungary and taught himself programming by punching machine code on Russian mainframes, is a restless, expansive personality. In April, he will become the fifth space tourist, paying $20 million to board a Russian Soyuz rocket and visit the International Space Station. Mr. Simonyi says he is not disgusted with big, bloated, buggy programs like Word and Excel. But he acknowledges that he is disappointed that we have been unable to use �our incredible computational ability� to address efficiently �our practical computational problems.� �Software is truly the bottleneck in the high-tech horn of plenty,� he said. Mr. Simonyi began thinking about a new method for creating software in the mid-1990s, while he was still at Microsoft. But his ideas were so at odds with .Net, the software environment that Microsoft was building then, that he left the company in 2002 to found Intentional Software. �It was impractical, when Microsoft was making tremendous strides with .Net, to send somebody out from the same organization who says, �What if you did things in this other, more disruptive way?� � he said in the January issue of Technology Review. For once, that overfavored word � �disruptive� � is apt; intentional programming is disruptive. It would automate much of software development. The method begins with the intentions of the people inside an organization who know what a program should do. Mr. Simonyi calls these people �domain experts,� and he expects them to work with programmers to list all the concepts the software must possess. The concepts are then translated into a higher-level representation of the software�s functions called the domain code, using a tool called the domain workbench. At two conferences last fall, Intentional Software amazed software developers by demonstrating how the workbench could project the intentions of domain experts into a wonderful variety of forms. Using the workbench, domain experts and programmers can imagine the program however they want: as something akin to a PowerPoint presentation, as a flow chart, as a sketch of what they want the actual user screen to look like, or in the formal logic that computer scientists love. Thus, programmers and domain experts can fiddle with whatever projections they prefer, editing and re-editing until both parties are happy. Only then is the resulting domain code fed to another program called a generator that manufactures the actual target code that a computer can compile and run. If the software still doesn�t do what its users want, the programmers can blithely discard the target code and resume working on the domain workbench with the domain experts. As an idea, intentional programming is similar to the word processor that Mr. Simonyi developed at PARC. In the jargon of programming, Bravo was Wysiwyg � an acronym, pronounced WIZ-e-wig, for �what you see is what you get.� Intentional programming also allows computer users to see and change what they are getting. �Programming is very complicated,� Mr. Simonyi said. �Computer languages are really computer-oriented. But we can make it possible for domain experts to provide domain information in their own terms which then directly contributes to the production of the software.� Intentional programming has three great advantages: The people who design a program are the ones who understand the task that needs to be automated; that design can be manipulated simply and directly, rather than by rewriting arcane computer code; and human programmers do not generate the final software code, thus reducing bugs and other errors. NOT everyone believes in the promise of intentional programming. There are three common objections. The first is theoretical: it is based on the belief that human intention cannot, in principle, be captured (or, less metaphysically, that computer users don�t know what people want). The second is practical: to programmers, the intentional method constitutes an �abstraction� of the underlying target code. But most programmers believe that abstractions �leak� � that is, they fail to perfectly represent the thing they are meant to be abstracting, which means software developers must sink their hands into the code anyway. The final objection is cynical: Mr. Simonyi has been working on intentional programming for many years; only two companies, bound to silence by nondisclosure agreements, acknowledge experimenting with the domain workbench and generator. Thus, no one knows if intentional programming works. Sheltered by Mr. Simonyi�s wealth, Intentional Software seems in no hurry to release an imperfect product. But it is addressing real and pressing problems, and Mr. Simonyi�s approach is thrillingly innovative. If intentional programming does what its inventor says, we may have something we have seldom enjoyed as computer users: software that makes us glad. Jason Pontin is the editor in chief and publisher of Technology Review, a magazine and Web site owned by M.I.T. E-mail: [pontin-:-nytimes-:-com]. | |
| Henrik: 19-May-2010 | Maxim, it could probably be used, but it fails more than it should: I own the Mass Effect game, which allows movement of the character via tilting the iPod, but you need a frame of reference to do that, hence you must sit very still when playing the game, and you must perform calibration, if you change your position. Another app is a bit more reasonable: A star chart app that I have, will change the field of view if I move the iPod over my head, perpendicular to my face, but it has limited usefulness. | |
| Oldes: 6-Aug-2010 | And so it's in this chart as well I guess. | |
| Kaj: 25-Aug-2011 | It means he's admitting that he's going downhill. And remember the organisation chart Doc found a while ago? | |
| ddharing: 25-Aug-2011 | What did the chart show? | |
| Group: #Boron ... Open Source REBOL Clone [web-public] | ||
| Anton: 12-Jul-2006 | I went to wikipedia and it has an IRC comparison chart :) | |
| Group: Postscript ... Emitting Postscript from REBOL [web-public] | ||
| Graham: 6-Apr-2006 | If I get time, I'll see if I can create a web service that turns growth data into CDC chart. | |
| [unknown: 9]: 8-Apr-2006 | Henrik, thanks, I will play with it. I have this great Mac sitting on my desk, but I don't seem to use it enough. NOTE: I'm still tied to my PC, and TRYING to get away....so far it seems I'm held to just a couple of issues....I have not had time to write up the "PC MAC LINUX" chart I want so I can figure out what it takes for me to move over. But the first big one is still a thumbnailer. I use ThumbPlus. If they were on Mac and Linux, then I think the move would be a lot better. I use this about 10 times every day. We can move this chat if you want to engage me on the Mac issue. | |
| Group: !Cheyenne ... Discussions about the Cheyenne Web Server [web-public] | ||
| Graham: 24-Jul-2007 | the free version only allows one or two graphs per chart | |
| Terry: 9-Jan-2010 | A couple lines of code and you could create a live chart displaying the various times folks are getting, including geo location etc | |
| Group: !CureCode ... web-based bugtracking tool [web-public] | ||
| Dockimbel: 22-Sep-2009 | Nope, it's Google's Chart API work :-) | |
| Dockimbel: 22-Sep-2009 | http://code.google.com/intl/fr-FR/apis/chart/ | |
| Steeve: 22-Sep-2009 | pie-chart: func [
con [block!] ;-- block of overriden constants
cmd [block!] ;-- commands to draw the pie-chart
/local push angle middle bottom pane bout sens
size back-color start line text
][
;-- default constants (overridable by con block)
size: 300x200 ;--size of the box
back-color: white ;-- back color of the drawing
start: -90 ;-- starting angle of the pie chart (in degrees)
line: [pen gray line] ;-- draw block used for lines
text: [pen none fill-pen gray text vectorial] ;-- draw block used
for texts
;--
do bind con 'size
pane: make block! 30
push: func [data][append pane compose data]
center: size / 2 ; -- center of the pie chart
radius: to-pair divide min size/x size/y 2.5
sens: true
bottom: 0
foreach [title color percent] cmd [
if issue? color [color: to-tuple debase/base color 16]
push [pen back-color fill-pen (color) arc center radius (start) (angle:
round/ceiling percent * 360) closed]
middle: angle / 2 + start
push line
push [
(center + as-pair radius/x * cosine middle radius/x * sine middle)
(bout: center + as-pair radius/x + 3 * cosine middle radius/x + 3
* sine middle)
]
either 0 <= cosine middle [
unless sens [bottom: 0 send: true]
push reduce [
bout: as-pair center/x + radius/x bout/y
bout: as-pair bout/x + 8 max bout/y bottom
bout: as-pair bout/x + 3 bout/y
]
bottom: bout/y + 12
][
if sens [bottom: size/y sens: false]
push reduce [
bout: as-pair center/x - radius/x bout/y
bout: as-pair bout/x - 8 min bout/y bottom
bout: as-pair bout/x - 3 bout/y
]
bottom: bout/y - 12
bout: as-pair bout/x - first size-text make face [
size: 5000x5000
text: title
] bout/y
]
push text
push [(bout + 1x-8 ) (title)]
start: start + angle
]
pane
]
| |
| Steeve: 22-Sep-2009 | Not perfect but it give results.
pie: pie-chart [
size: 300x200
start: -80
][
"block" none 0
"crash" #ff3030 .04
"major" #ff6060 .09
"minor" #ffb850 .44
"tweak" #ffd850 .03
"text" #ffd850 .02
"trivial" #ffd8a0 .31
"not a bug" pewter .06
]
view layout [
box 300x200 white effect [draw pie]
]
| |
| Steeve: 22-Sep-2009 | try this on linux...
pie: pie-chart [
size: 300x200
start: -80
text: [pen gray text ]
][
"block" none 0
"crash" #ff3030 .04
"major" #ff6060 .09
"minor" #ffb850 .44
"tweak" #ffd850 .03
"text" #ffd850 .02
"trivial" #ffd8a0 .31
"not a bug" pewter .06
]
view layout [
box 300x200 white effect [draw pie]
]
| |
| Dockimbel: 22-Sep-2009 | Linux (Ubuntu 8.04 under Vmware) : - 1st version: drawing ok, but no text - 2nd version: no pie chart, no text, only 1 line (first one in list maybe) | |
| Steeve: 22-Sep-2009 | pie-chart: func [
con [block!] ;-- block of overriden constants
cmd [block!] ;-- commands to draw the pie-chart
/local push angle middle bottom pane bout sens
size back-color start line text font* font
][
;-- default constants (overridable by con block)
size: 300x200 ;--size of the box
back-color: white ;-- back color of the pie
font: make face/font [color: gray size: 12]
start: -90 ;-- starting angle of the pie chart (in degrees)
line: [pen gray line] ;-- draw block used for lines
;--
do bind con 'size
font/offset: 0x0
pane: make block! 30
push: func [data][append pane compose data]
center: size / 2 ; -- center of the pie chart
radius: to-pair divide min size/x size/y 2.5
sens: true
bottom: 0
font*: font
foreach [title color percent] cmd [
if issue? color [color: to-tuple debase/base color 16]
push [pen back-color fill-pen (color) arc center radius (start) (angle:
round/ceiling percent * 360) closed]
middle: angle / 2 + start
push line
push [
(center + as-pair radius/x * cosine middle radius/x * sine middle)
(bout: center + as-pair radius/x + 3 * cosine middle radius/x + 3
* sine middle)
]
text: to-image make blank-face [
size: size-text make face [size: 5000x5000 text: title font: font*]
text: title
font: font*
color: none
]
either 0 <= cosine middle [
unless sens [bottom: 0 sens: true]
push reduce [
bout: as-pair center/x + radius/x bout/y
bout: as-pair bout/x + 8 max bout/y bottom
bout: as-pair bout/x + 3 bout/y
]
bottom: bout/y + text/size/y
][
if sens [bottom: size/y sens: false]
push reduce [
bout: as-pair center/x - radius/x bout/y
bout: as-pair bout/x - 8 min bout/y bottom
bout: as-pair bout/x - 3 bout/y
]
bottom: bout/y - text/size/y
bout: as-pair bout/x - text/size/x bout/y
]
push [image (text) (bout + as-pair 1 text/size/y / -2 - 0.5 ) black
]
start: start + angle
]
pane
]
| |
| Steeve: 22-Sep-2009 | pie: pie-chart [
size: 300x200
start: -80
font: make font [size: 10]
][
"block" none 0
"crash" #ff3030 .04
"major" #ff6060 .09
"minor" #ffb850 .44
"tweak" #ffd850 .03
"text" #ffd850 .02
"trivial" #ffd8a0 .31
"not a bug" pewter .06
]
view layout [
box 300x200 white effect [draw pie]
]
| |
| Brock: 1-Aug-2010 | Chris' Google Chart API Dialect may be what you are looking for. http://www.rebol.org/view-script.r?script=charts-api.r | |
| Group: !REBOL3 GUI ... [web-public] | ||
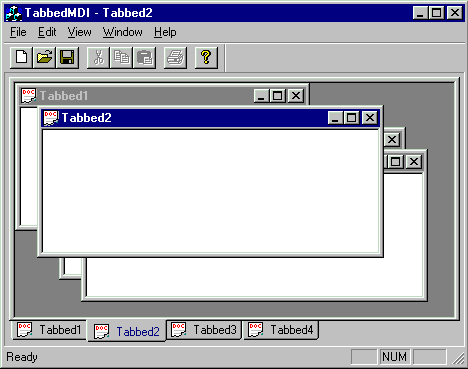
| Henrik: 1-Jan-2011 | Guys, time to crank up the volume and build a concrete roadmap for the GUI. I have a suggestion to further accelerate the development of the GUI: RM Asset will over time require some specific, but complex styles, that the community will need as well. We are developing a SCRUM tool, which you will need to use as a basis for discussions and development of these styles. Consider it also training to become a good style developer. For any needs, Cyphre, Bolek, Ladislav and I will be available to extend the UI base as needed to create the styles mentioned below. We also provide examples, training and help. Many of these styles are focused for development of particular types of applications that open many, small windows inside a large work area for flexible construction of data analysis tools and other traditional Windows or Linux applications. It could be a combination of how graphics shader networks are built (though without the need for zooming), to regular multi-document management. The ultimate goal is to build styles that allow a highly user configurable multi-document GUI to be described, using only the R3 GUI dialect and some helper functions that we already have. These styles are generic enough to be usable in plenty of apps. Inspirations for window arrangements: http://houdini.dreamerzstudio.net/wp-content/uploads/2010/05/reflectiveShaderNetwork.jpg http://www.codeproject.com/KB/docview/TabbedMDI/TabbedMDI.gif Inspiration for segmented area management: http://www.solidsmack.com/wp-content/uploads/2010/12/modo_501_RayGL_sample_002.jpg http://jedit.sourceforge.net/jedit-snap-12.png A list of general styles that definitely are needed: - Style for doing multi-document window management, using various arrangements, window linking features, as borrowed from apps like Photoshop. - Style for segmented area management, editable by users, for arranging tool areas, view areas. Segments are adjustable in size. Inspiration is JEdit and Modo. - Multi-document window style, for use in window management style - Tool window style, for use in window management style - Tear-off style for toolbars and tool windows, for use in window management style - Regular Windows-style menu bar with submenus, also for right-click popup menus. More specific styles that will be needed later: - High-performance style for graphing points and curves in a coordinate system, with zooming and panning. - Gannt chart style: http://en.wikipedia.org/wiki/Gannt_Chart - Harvey Ball style: http://en.wikipedia.org/wiki/Harvey_Balls - Year calendar style - Month calendar style - Week calendar style - Day calendar style - MacOSX style tag field: http://kitara.nl/wp-content/uploads/2010/05/31.png - Console style for input and listing results. This could eventually grow into the base for a View based R3 console. - Highly ergonomic numeric input styles, that support unit conversion, inline math. The question is where to start and what fits with you. The time table is simply ASAP, and preferrably want some results within the next 2 months. If you are planning R3 apps soon, it would be a good idea to have a look at the list to see where you may be able to contribute, as the GUI moves to beta status. RM Asset needs to spend time building end-user apps for R3 and the GUI is becoming ready, except for the above mentioned styles. | |